
This week I will be showing you how to do some simple queries in Microsoft Access, and then showing a bit more complicated query to create a node and edge dataset for use in social network analysis. The data to follow along (two Access databases) can either be downloaded from this Dropbox link, or downloaded from ELearning.
Access is another Microsoft office tool, but one that is specifically used to create and query relational databases. You’ve been introduced to tables in Excel – Access is only tables. In Excel you can decide to type something random in cell B157 or AA5 if you want. That is not the case in Access, it has defined rows and columns for each table, where only specific information goes in each.
This may seem like a downside, and that Excel is more flexible. Access is a much better tool to work with large datasets though, it will be much faster. So it is better to do queries in Access, and then pipe the data over to Excel to finish the analysis. The fact that Access ensures data integrity for what is in its tables allows you to query and link them much more efficiently. You use a programming language called SQL (often pronounced see-quell) to conduct those queries.
For a pro-tip, even if your database for your CAD system is is another file format, you can link it to an Access database (by creating a linked table). So this advice pretty much generalizes to all different types of databases.
To start, open up the Small_Example_Database.accdb file, which is an Access database. You should see just two tables in the Table of Contents on the left hand side, one named Incidents and the other named People.
Go ahead and double click on the Incidents table. This will show you the contents for the table – it looks very similar to an Excel spreadsheet, with columns showing certain variables, and rows having the data.

Now go ahead and click on the People table and check it out.

I’ve intentionally made these tables very tiny and simple to illustrate the use of a programming language called SQL to manipulate them. Just with these tiny snippets I can show you the nuts-and-bolts of the majority of queries you will want to make in not only a job as a crime analyst, but any data analysis job!
In the Access database in the top Ribbon, navigate to the Create tab, and select the Query Design button:

You will get a pop-up, and you can go ahead and just close out that window (there is a GUI interface to do some SQL, but I prefer just to show you the code here).

Now right click on the Query1 tab, and select SQL view.

This will now bring up a window in which you can type your SQL query directly. By default mine simply shows as SELECT;

Now go ahead and in the query window type SELECT IncidentID, DateIncident FROM Incidents;. (NOTE there is no comma after DateIncident and before FROM.) When writing code, you need to make sure that everything is spelled correctly (and in the same case, e.g. you you typed dateincident instead of DateIncident the code would not work!). Now in the top ribbon, select the Design tab under the Query Tools area, and then hit the Run button (the big red exclamation point).

And boo-ya, you have your table. All we did here was select two columns, the Incident ID and the date of the incident. It returns all five rows of the table. The SQL code is pretty intuitive (why I do not mind teaching you some code!), and I will show some more examples.

Now the next example I am going to give using SQL is to select certain records. Right click on your Query1, and go back to the SQL view. Now we are going to add a condition to filter statements out, so add into your query the fields IncidentType and NIBRS_Code, and then add in a WHERE clause to only select NIBRS_Code’s that are under 1500. In the end the SQL should be SELECT IncidentID, DateIncident, IncidentType, NIBRS_Code FROM Incidents WHERE NIBRS_Code < 1500; (and below I formatted the code with line breaks to make it easier to read):

Go ahead and run that SQL code, and you will see now that it only includes 2 rows in the resulting table – only those with NIBRS codes underneath the filter.

Besides inequality constraints (less than or greater than), you can also do exact equality constraints (e.g. WHERE IncidentType = 'Robbery). You can add multiple constraints together as well, here I select out NIBRS_Codes over 2000, and dates before 10/11/2019.
SELECT
  IncidentID,
  DateIncident,
  IncidentType,
  NIBRS_Code
FROM Incidents
WHERE NIBRS_Code > 2000 AND DateIncident < #10/13/2019#;
And this produces the table:

To use the current date in this calculation, instead of #10/15/2019# you would write Date(). So for example, if you wanted to take all of the robberies that occurred within the past 30 days (of when you execute the query), you could do a query along the lines of SELECT * FROM Incidents WHERE DateIncident >= Date() - 30;. (The code SELECT * FROM Table selects all of the fields in that table.)
You can see in that last example I made my own calculation, Date() - 30. You can add in your own fields into the query as well. Get rid of the WHERE clause in the SQL query, and add in another data field that is Date() - DateIncident AS DaysOld. So our query now looks like:
SELECT
  IncidentID,
  DateIncident,
  IncidentType,
  NIBRS_Code,
  Date() - DateIncident AS DaysOld
FROM Incidents;
And run the query and you now have the table (yours will look different, since you are running it on a later date, I am doing this example on 10/15/19):

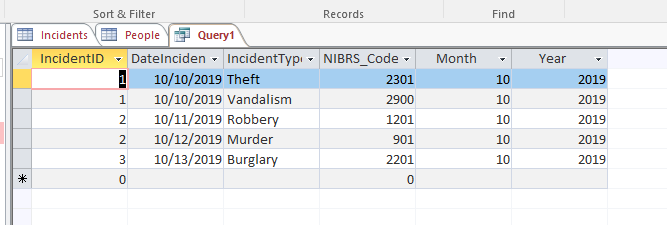
Another common example is to create date aggregations, say you wanted to select all of the robberies in October 2019, you could do something along the lines of:
SELECT
  IncidentID,
  DateIncident,
  IncidentType,
  NIBRS_Code,
  MONTH(DateIncident) AS Month,
  YEAR(DateIncident) AS Year
FROM Incidents
WHERE MONTH(DateIncident) = 10 AND YEAR(DateIncident) = 2019;
And this produces the table:
So you can see you can both create calculated fields in the returned dataset (similar to simple functions in Excel), as well as use them in WHERE conditions here. You can basically use those calculated fields in whatever part of the SQL query you want though. Another example that is useful when making reports is to create a dummy variable, equal to 1 if a condition is true. You can use the IIF() statement, which works almost the same as an IF function in excel – the arguments it takes are the condition, the value if true, and the value if false.
SELECT
  DateIncident,
  IncidentType,
  IIF(IncidentType="Robbery",1,0) AS Robbery
FROM Incidents;
That may seem like a strange example, but will come in handy when doing aggregate counts of crime over time. Which I will show in the next page.
Another common application of SQL queries is not just to filter data, but to create aggregations – very similar to Excel pivot tables. To do this you can use the GROUP BY statement.
SELECT
  DateIncident,
  COUNT(DateIncident) AS NumberPerDay
FROM Incidents
GROUP BY DateIncident;
You can see we used the COUNT() function to get us the total number of incidents per day. When aggregating, same as for pivot tables, you need to say how exactly you are aggregating the events. Here it doesn’t really matter what field you place inside of the COUNT() function. (There are other aggregate functions, like AVERAGE and SUM, that do matter what you place in them, and only make sense for numeric data.) You can also add in a WHERE statement to the aggregation. (WHERE goes before GROUP BY, GROUP BY pretty much always goes last.)
SELECT
  DateIncident,
  COUNT(DateIncident) AS NumberPerDay
FROM Incidents
WHERE IncidentType = "Robbery"
GROUP BY DateIncident;
You can see here though that it only returns one row, on 10/11/19. If you want to make a graph over time, you will have 0 days missing from the resulting table. A trick is to then use the dummy variable approach I mentioned before, and use the SUM aggregate command.
SELECT
  DateIncident,
  COUNT(DateIncident) AS NumberPerDay,
  SUM(IIF(IncidentType="Robbery",1,0)) AS RobberyPerDay
FROM Incidents
GROUP BY DateIncident;
And now you can see we have days that even have 0 robberies. If you wanted to do a regular report on a select set of crimes of interest (e.g. Part 1 UCR crimes), you could just keep adding additional tables.
So far all of the examples have been manipulating one table. But another benefit of Access is that you can merge multiple tables together. To do this, you need a key that says how to link the two tables together – a variable that is common to each. In this simplified example, the Incidents table and the People table both have a field named PersonID. So we will have three updates to this query: one is that the FROM statement now names both of our tables, and then gives them synonyms (Incidents is shortened to I, and People is shortened to P). Two, is that we now have an ON statement that says what two variables link the tables together. Third, in our original variable names, we have to preface the fields as to which table they come from. So we have three fields from the I table, and two fields from the P table.
SELECT
  I.DateIncident,
  I.IncidentType,
  I.PersonID,
  P.FirstName,
  P.LastName
FROM Incidents AS I LEFT JOIN People AS P
ON I.PersonID = P.PersonID
In this example, you can see that one person is merged to multiple incidents – a one to many join. To go the other way, to merge the incident data to the person data, requires you to aggregate the incident data so it is only one record. It is a bit annoying in this example, as you need to specify an aggregate function for every field, even though in the end the People table does not end up being aggregated. (So you can use MIN/MAX as a stand in, which works even for string data.)
SELECT
  MAX(P.PersonID) AS PersonID,
  COUNT(I.PersonID) AS CountIncidents,
  MAX(P.FirstName) AS FirstName,
  MAX(P.LastName) AS LastName
FROM People AS P LEFT JOIN Incidents AS I
ON P.PersonID = I.PersonID
GROUP BY I.PersonID
Here you can see Iron Man has zero associated incidents. Whereas myself and Delilah have two. I often would not do it this way though, but would first create a query to aggregate the incident table, and then merge that aggregated incident table to the person table. I will show that next.
So lets do what I just said, aggregate incidents to the person level, and then merge that aggregated table to the person database. So lets first make an aggregate query on the incident table that counts up the total number of incidents, as well as the total number of robbery incidents.
SELECT
  PersonID,
  COUNT(PersonID) AS CountIncidents,
  SUM(IIF(IncidentType="Robbery",1,0)) AS RobInc
FROM Incidents
GROUP BY PersonID
Check and make sure that your query works, and now right click on the Query1 tab and select SAVE AS

Now lets name this query as PersonStats_00. I use this naming convention, QueryDescript_##, so I can know what queries go together and in what order.

Then you should see that there is a new query in the table of contents on the left, and that the tab is renamed as well. Go ahead now and create a new query, and name it PersonStats_01. In this query, we are going to merge our last query with our People table. You can treat the prior PersonStats_00 query they same as any other table, and I use a left join to match the two together. I added in the ORDER BY statement at the end – this does not change the data, just the order of the rows (same as sorting a table in Excel). I sort those with the most incidents to the top of the dataset.
SELECT
  P.PersonID,
  P.FirstName,
  P.LastName,
  S.CountIncidents,
  S.RobInc
FROM People AS P LEFT JOIN PersonStats_00 AS S
ON P.PersonID = S.PersonID
ORDER BY S.CountIncidents DESC;
You can see here that Tony Stark has missing data in this query, instead of 0’s. One way to fix that is to use the NZ function and then add 0 to the result (NZ stands for Null-Zero, so treat a null value like 0). Here I left the CountIncidents field as is so you can see the difference in the results.
SELECT
  P.PersonID,
  P.FirstName,
  P.LastName,
  S.CountIncidents,
  NZ(S.RobInc) + 0 AS RobInc
FROM People AS P LEFT JOIN PersonStats_00 AS S
ON P.PersonID = S.PersonID
ORDER BY S.CountIncidents DESC;
I am going to show one more example of stringing multiple queries together. This task highlights the utility of Access – it is very difficult to accomplish what I am going to show in Excel, but can be reduced to just a few queries in Access. For UCR reporting, you need to select the Top Charge per incident, so if you have an incident with a burglary and an aggravated assault, you don’t count both for UCR reporting, you would only count the aggravated assault. So here what we are going to do is select out the top charge per incident, then aggregate those incidents into a report you might do for a monthly UCR reporting.
So our first table is going to use the MIN aggregate function on the NIBRS codes that are within the incidents (lower NIBRS codes are more serious incidents). Name this query TopCharge_00.
SELECT
  MIN(NIBRS_Code) AS TopNIBRS,
  IncidentID
FROM Incidents
GROUP BY IncidentID;
Second, we are going to merge the TopNIBRS code back into the Incidents table. When doing that we can select out only incidents that are the top charge using a WHERE statement. Also we need to do an additional aggregation to prevent incidents with multiple of the same charges from being selected. This ultimately gets us our unique ID for the specific incident that will count as our top charge in the final dataset. Name this query TopCharge_01.
SELECT
  MIN(I.AutoID) AS AutoID,
  MIN(I.IncidentID) AS IncidentID,
  MIN(T.TopNIBRS) AS TopNIBRS
FROM Incidents AS I LEFT JOIN TopCharge_00 AS T
ON I.IncidentID = T.IncidentID
WHERE I.NIBRS_Code = T.TopNIBRS
GROUP BY I.IncidentID;
Now we can merge back in our information on the date the incident occurred, as well as the generic name of the incident. We are merging now by the AutoID column, which is unique within each incident. Also add in our time variables, Month and Year, based on the date of the incident. Name this third query TopCharge_02.
SELECT
 S.AutoID,
 S.IncidentID,
 I.IncidentType,
 I.NIBRS_Code,
 I.DateIncident,
 MONTH(I.DateIncident) AS Month,
 YEAR(I.DateIncident) AS Year
FROM TopCharge_01 AS S LEFT JOIN Incidents AS I
ON S.AutoID = I.AutoID;
Now we are going to make our crime counts per year and month and crime type using an aggregate statement. We eliminate murder, as those get reported by the total number, so we will need to make a separate query to deal with that. You can then use multiple fields in the GROUP BY statement as well to get our aggregate counts. Name this query TopCharge_03.
SELECT
  Year,
  Month,
  IncidentType,
  COUNT(IncidentType) AS CrimeCount
FROM TopCharge_02
WHERE IncidentType <> 'Murder'
GROUP BY Year,Month,IncidentType;
And at this point this is what the query results should look like:
Depending on your reporting needs, you may want to have the data in wide format, not long format. You can PIVOT the data in Access using alittle bit of a different type of query (Access describes this as a crosstab). Basically this uses the text in the IncidentType field to rename the columns.
TRANSFORM MAX(CrimeCount)
SELECT
  Year,
  Month
FROM TopCharge_03
GROUP BY Year, Month
PIVOT IncidentType;
These are simplified examples, but combining all of those different elements, you can nearly do any type of data manipulation that you want. Then to do your final analysis (making nice graphs and tables to disseminate), you can link the Access tables/queries into Excel. Which I will show in the next section.
Open up the second Access database I have provided, the Stop_Gang_Example.accdb. This is simulated data, but will look very similar to how a real police database would look (minus that it has many fewer fields). I am going to show how to go from a typical records management database to an edge dataset (which shows who is linked to who), for use in social network analysis.
First, create a simple query where you select out only 1 incident, (number 116628) from the FieldStops table. This is an incident with three people associated. So based on this, we want to define three connections – 40371 to 1237837, 40371 to 1306631, and 1306631 to 1237837. I am going to show the logic of creating the edge database first on this simple table, and then move on to the bigger table. Name the query SubTable.
SELECT *
FROM FieldStops
WHERE incid_no = 116628;
Now make a second query. This is another type of JOIN I am going to show you here, called an INNER JOIN. This will join a table to itself. So if we have an incident with three records (say A,B,C), this join will subsequently create all combinations of potential records, A:A, A:B, A:C, B:A, B:B, B:C, C:A, C:B, C:C. The SQL to do this would be:
SELECT
  F.personid  AS P1,
  S.personid AS P2,
  F.incid_no
FROM SubTable AS F INNER JOIN SubTable AS S
ON F.incid_no = S.incid_no;
In the end we do not want redundant edges, e.g. we only need either a record for 1306631 -- 40371 or 40371 -- 1306631, we don’t need both. Also we don’t need an edge from a person to themselves, e.g. 1306631 -- 1306631. We can use a simple trick though to eliminate both, only select P1 records that are less than P2 values. (This trick will work even if the person ID fields are strings.)
SELECT
  F.personid  AS P1,
  S.personid AS P2,
  F.incid_no
FROM SubTable AS F INNER JOIN SubTable AS S
ON F.incid_no = S.incid_no
WHERE F.personid < S.personid;
Now that you’ve seen that example, I am going to replace the query with the full FieldStops table. Even with over 100,000 records, this runs in just a second or two.
SELECT
  F.personid  AS P1,
  S.personid AS P2,
  F.incid_no
FROM FieldStops AS F INNER JOIN FieldStops AS S
ON F.incid_no = S.incid_no
WHERE F.personid < S.personid;
Now as a final step, this current query returns the links for every incident. So you could see how the links change over time. Most examples though to SNA do not take this into account though. One simple way to show the strength of the association between two individuals is not only if they have been stopped together once, but how many times they have been stopped together. To do this, we can again use GROUP BY. Also I show how you can limit the results to the TOP # of your choosing as well (here I just grab the top 20 most linked people). Similar to Excel, if there are ties as to the top they will also be included.
SELECT TOP 20
  F.personid  AS P1,
  S.personid AS P2,
  COUNT(F.incid_no) AS Ties
FROM FieldStops AS F INNER JOIN FieldStops AS S
ON F.incid_no = S.incid_no
WHERE F.personid < S.personid
GROUP BY F.personid, S.personid
ORDER BY COUNT(F.incid_no) DESC;
This edge table is the basic part you need to do social network analysis. And you can add in further information into this table the same way as you do to any table. If you want to add in person info though you need to add it in two steps (merge to P1 and then merge to P2).
For your homework, for the first part of the homework, using the Stop_Gang_Example database, create a table of the stops for each gang per each year in the database. (The steps will be merge the gang table person id’s into the field stop table, then aggregate by year and gang.) (Five points extra credit to make a graph to visualize that information.)
For the second part, I want you to create a table of all the individuals who are connected to JOSLYN GUTIERREZ (with a person id of 1316697). Include in this table the peoples names, as well as their gang affiliation (not all individuals will have an associated gang). This is called an ego network of Joslyn’s.
Do not turn in an Access database for the assignment. Either export the tables to make them nice in Powerpoint, or create screenshots to place in Powerpoint (and then export to a PDF file).
Gephi is the best free tool to use to make social network diagrams, https://gephi.org/. I will need to update this at a later point to illustrate its use.